Companies of All Types and Sizes are Utilizing Data Visualization Techniques to Empower Strategic Decision Making
Regardless of the type or size of your business, you and your teams build, interact with, and utilize your most valuable assets every day, your data sets. Every customer invoice, supplier payment, tax record, and so on would not come into existence without the underlying information used to create it. Regulatory authorities, state departments of revenue, and the Internal Revenue Service all require businesses to maintain certain records, as do creditors and investors. Scores of organizations routinely perform record-keeping activities to satisfy these basic obligations. Simultaneously, they may not consider how rich the underlying data is and how they can harness it for strategic purposes.
As an example, let’s use a simple Billing Statement. Companies regularly send their customers monthly statements showing how much is owed for products and services and the accepted payment methods. On the surface, this routine activity serves the basic purpose of communicating a balance due and requesting payment. Further inspection yields a more robust picture. Producing the Billing Statement required a rich set of data. The preparer needed information about the customer, what was purchased, the price, the location, and how much sales tax to collect. Gathering all of that information for the Billing Statement allowed for the opportunity to record the information in the company’s records via a process or system that enabled its use in other processes. Those processes might include performing sales tax compliance activities, recording accounts receivable, collecting past due receipts, or building a future sales forecast.
The billing account statement is just one example. Every record collected is similarly multi-faceted, serving numerous purposes and touching various diverse functional areas within the company. With this in mind, it is apparent how advantageous it is for companies to optimize the capture and storage of data for efficient use in many different processes.
Several concepts ring true about business data:
- Having a strong end-to-end framework for managing data in an organization is vital to provide access to the right data at the right time for all its required uses.
- People, processes, and technology must work well together to ensure that data flows as efficiently as possible from the start of business processes to the end.
- Many business processes overlap. Instead of optimizing data flows in a single software system or across a single department or functional area, it is important to take extra care to ensure smooth integration between systems. It is well worth the effort to ensure teams and systems communicate well across all operations.
- Good data management can improve business strategy development. Data visualization techniques can harness the data collected through your routine record-keeping framework and become a powerful tool for making timely strategic decisions. Data visualization makes it possible to review results against targets quickly and easily, absorb information about markets, customers, suppliers, and opportunities, and so much more.
When one thinks of data visualization, large companies may come to mind. However, medium-sized companies, start-ups, or small business owners can benefit as well, regardless of the record-keeping software used or the number of employees.
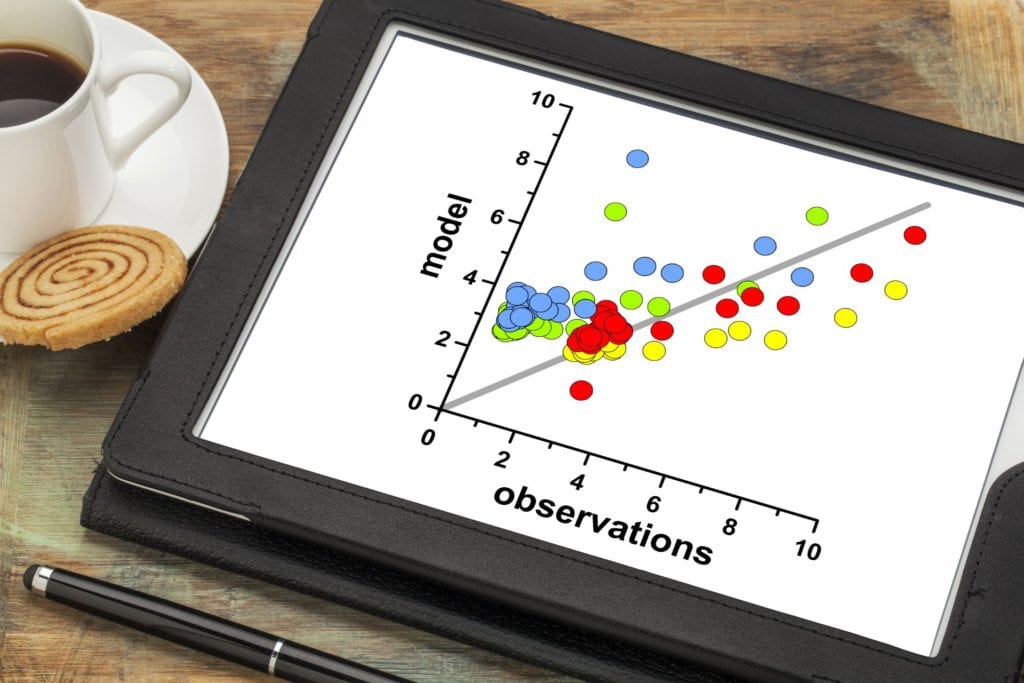
The discussion of data visualization would not be complete without defining it and mentioning examples. In a nutshell, data visualization is a process for turning records into meaningful pictorial images that show trends, outliers, and patterns. Specific examples include bar charts for comparing percent of spending by department, scatterplots for investigating the relationship between two things such as technology early adopters’ and laggards’ for smartphone purchases, or histograms for understanding the distribution of data, like the frequency of product defects in a manufacturing process.
Charts can be combined into easily updatable electronic dashboards that show business leaders, employees, and any other stakeholders the story of a business in terms of its past, present, and future. Charts can also be used in market research or to predict outcomes give certain inputs. The list of potential uses is lengthy.
Many large companies are starting to add data visualization competencies to their organizations by purchasing software licenses and hiring data stewards, designers, and data scientists. Fortunately, smaller businesses can utilize these tools as well, without hiring a large technical staff or buying more software. Lenox Accounting LLC is proud to offer such data visualization solutions to smaller companies. Contact us to discuss how.